“…the only place on earth where all places are—seen from every angle, each standing clear, without any confusion or blending” “El Aleph”, Jorge Luis Borges
What if people could contribute to open source 3D maps just by taking and sharing photos? These experiments with generating point clouds are an attempt to figure out how to make that possible.
Point Clouds and LIDAR
Point clouds are not new, but new devices with more computational power and memory have recently made point cloud tech more accessible. From video games to the big screen, more and more points are being generated. Similarly, LIDAR technology isn’t all that new—for almost as long as laser technology has existed, scientists have been mounting laser scanners under planes to sends pulses of light to a surface and measure the precise distance to it. LIDAR is the technology that geolocates those points measured by those lasers. (It also seems to be interchangeably written as LIDAR, LiDAR, and lidar; I’m just going to use LIDAR because I LIKE SHOUTING.)
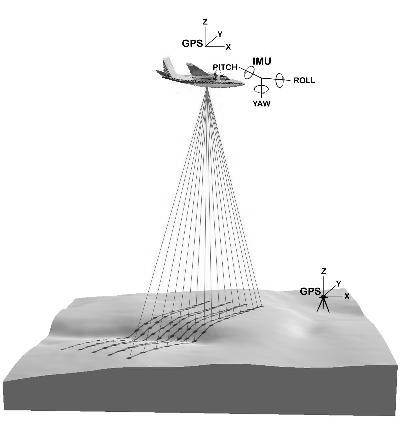
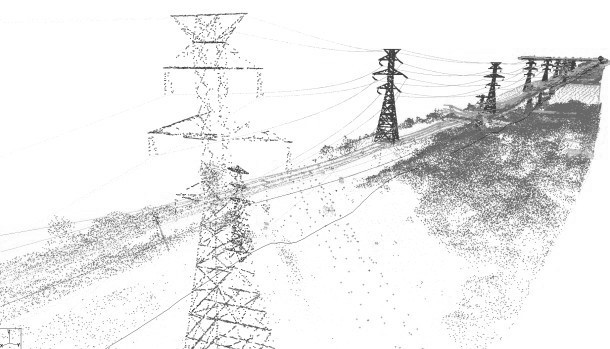
In the last few years, a new generation of smaller LIDAR devices have come to the market. They can be mounted on cars and backpacks, preserving every single point from a particular place—like holographic glass snow globes.
According to the closing law of gestalt psychology, human perception is very good at making sense of these clusters of dots. Our mind completes the empty spots. The more perspectives the sources have, the closer the point cloud map looks to the terrain.
In order to work with LIDAR data, you first have to merge and clean it. There are a couple of programs that help you do this at this scale; the best open source application I found was CloudCompare.
Once you’ve cleaned your LIDAR data, you have to think about serving and analyzing the data. PostGIS can be used to combine this LIDAR information with any map. A great introduction to this process is this tutorial from Yuriy Czoli where he uses the altitude of points to set the height of building on OpenStreetMap.
In my case, I was interested in creating ways for OpenStreetMap polygons to look more accurate. First I had to create some scripts to convert LIDAR data to other formats, then export them to PostGIS and extract single buildings or tiles from them.
All of these tools you can find at this LIDAR-Tools repository:
las2SM: re-project LIDAR files (.laz/.las) to Spherical Mercator (epsg:3857)las2tile: crop a tile from a LIDAR file (.laz/.las) and project to Spherical Mercator (epsg:3857)las2ply: export LIDAR files (.laz/.las) into .ply formatgetPointsForID: once a PostGIS database is loaded with LIDAR information of a region, this script gets all the points inside a tagged OSM polygon by providing the OSM ID.
Making point-clouds from pictures
But how many people just happen to own a LIDAR? They are expensive devices that only companies and governments can afford. As far as I know, that’s how “open” this technology is.
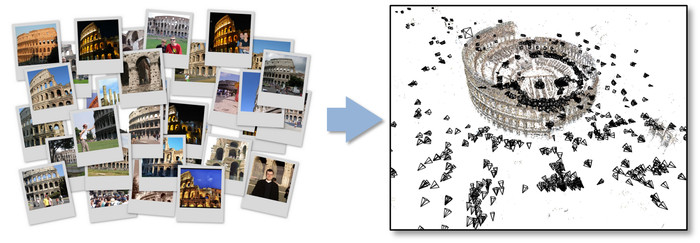
There is a way to achieve similar point cloud results without LIDAR, using a relatively older technique called photogrammetry, which requires just a regular camera and some patience (especially to compile the available open software). It stitches photographs together, finding distinctive assets and cross-similarities to construct 3D point clouds. Today, the most popular applications using this technology are PhotoSynth and 123D Catch. The are also some powerful open source equivalents, such us Bundler and VisualSfM.
My experiments with photogrammetry began with fieldwork: taking pictures of the Flatiron building. I followed Jesse Spielman’s tutorial to learn how to take better pictures, process them with VisualSfM, and clean the dense reconstruction with MeshLab.
I found this to be a really smooth and flexible work flow. Pictures can be taken in different moments of the day and with any camera. In my case, I finished adding a bunch of them with my cellphone because I was interested in using its GPS geolocation (which ended up being a whole new problem).
The results of the above process are: a point cloud of feature markers that contain information from the cameras called bundle.rd.out (from the bundler algorithm) and a big point cloud product of the dense reconstruction (from the pmvs2). Both files are coherent between each other. They share the same space coordinates. You can load them and experiment with them using this addon for openFrameworks.
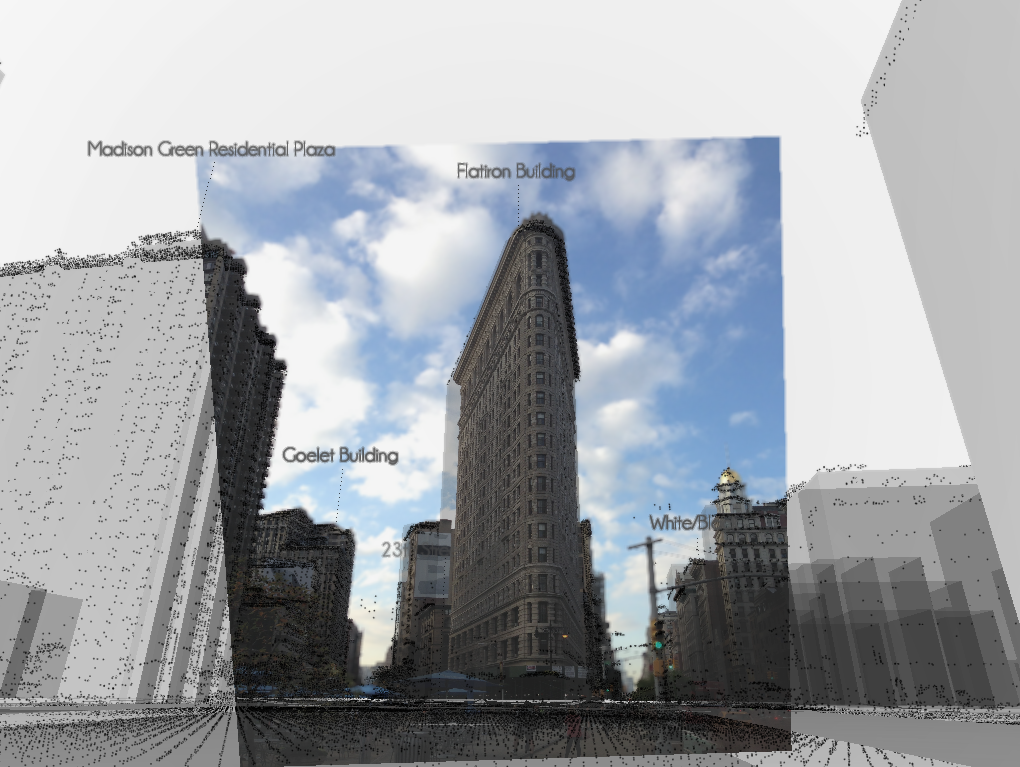
In order to import this data constructed just from photos to PostGIS, I had to find a way to georeference the point clouds. After taking more photos with my cellphone and using the GPS location hidden on the EXIF header, I was able to extract the centroid, approximated scale, and base rotation to level the cameras over the surface. The final adjustments (translation and precise orientation) were made by hand because of the incredible noise in GPS data thanks to the well-known “urban canyon” effect that makes satellite signals bounce between buildings.
The following images show the result of this process. The Flatiron points, photo images and extruded OSM polygons are displayed together. The abstract universe of maps is contrasted side by side with photographs and virtual points.
From Point Clouds to Meshes
Once I got a coherent universe of point clouds correctly geolocated, it was time to load them into my PostGIS database together with an OSM Metro Extract. To do that, you can follow this short tutorial. The reason to load the Metro Extract? You can use PostGIS geo-spatial query functions to extract with surgical precision a specific feature, such as the “Flatiron Building” or node:2517056822. Inside the repository LIDAR-Tools you will find a Python script call getPointsForID that will let you do this extraction without knowing how to make a PostGIS query.
With all the points of the Flatiron I was able to perform a Poisson Reconstructive Algorithm (using CGAL’s implementation) to construct a mesh from the points. You can find this tool at the LIDAR-Tools repository in the sub folder called xyz2Mesh. Alternatively you can use MeshLab’s, but I found that CGAL’s implementation works better.
Meshes to GeoJSON Polygons
Although I love how meshes look, they have too much information for what OSM can hold. This last step in the process is about downsampling the information we collect to something that can be uploaded and shared on the web.
OSM’s database isn’t really designed for 3D meshes. Basically all buildings are polygons with altitudes. Like layers of a cake, the polygons sit one on top of another. In order to make our mesh compatible with OSM we have to cut it into “slices” like a layer cake. In this repository you will find a program that does exactly that. It slices the mesh inch by inch, checking every slice with the previous one, if it finds a significant change on the area size, it adds that cut on top of our cake.
Next Steps
For this experiment I used an extraordinarily convenient sample. Beside being a beautiful building, the Flatiron is perfectly isolated construction. To apply this process to other buildings, extra steps have to be added to the pipeline. This was a proof of concept investigating the potential of mixing LIDAR information with SfM reconstructions as a way to crowdsource point clouds. While there’s still a lot of work to do to make that process simple and easy for the average user, these results and their potential applications are exciting.
