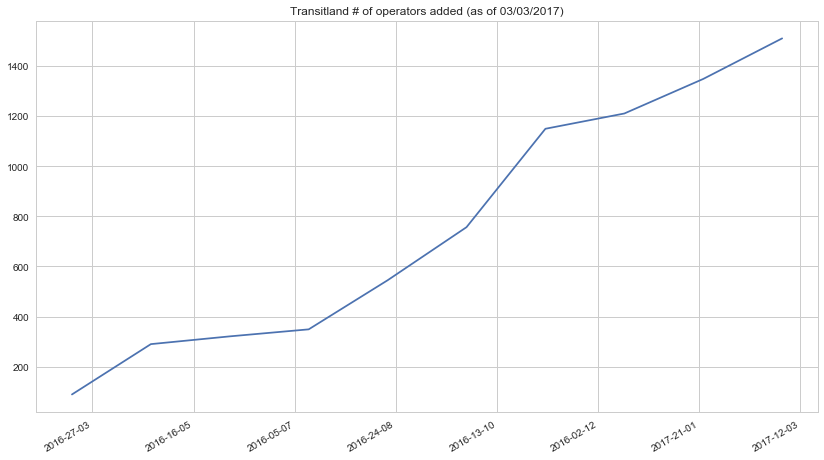
We opened Transitland to submissions a year ago, and boy have we come far together since then! As of today, Transitland includes data representing 1,511 transit operators:
These transit operators are located in 37 different countries:

Actually, we should say that these operators are located in at least 37 different countries, since many systems extend beyond the borders of their headquarter’s country.
As Transitland contributors stitch together coverage for new regions every day, the archipelago of interconnected transit islands grows into an ever larger network. This map shows tile squares where Mapzen Turn-by-Turn provides transit routing, using data provided by the Transitland Datastore. Each “island” of connectivity is displayed in a different color.
(Open the world full screen ➹ )
Coverage and interconnectivity is much more extensive than when we showed you this map last June!
As you zoom in, the view will change to colored boxes outlining the service area of each operator. Names of operators will then appear. Zoom in further, and in certain cities like SF and NYC, the transit lines will appear along with their names and colors. There’s a lot of data you can pull from the Transitland API and display in Tangram Play!
These submissions are thanks to 188 users. A big “thank you” to all!
We’d also like to thank, in particular, Steven Vance who has worked as Transitland’s contract “data editor” since last summer. Steven reviews incoming submissions and helps to debug problematic feeds.
We’re not finished. We welcome your submissions of additional coverage to the Transitland Feed Registry. It’s a simple process, so simple that we have a short video describing the steps.
If you’re itching to start using all of this open transit data, try browsing using the the Mapzen Mobility Explorer, plan a transit route using Mapzen Turn-by-Turn, or read about the Transitland Datastore API that powers those and other applications. You can also try adding the GeoJSON Transitland API response as a data source in Tangram Play.
In fact, both of these charts were made using calls to the Transitland Datastore API, and like most everything at Mapzen, they’re based on open-source code:
- Jupyter Notebook with Python code to generate the operators-by-created-date plot
- JavaScript code to generate the operators-by-country plot using d3/Vega Lite
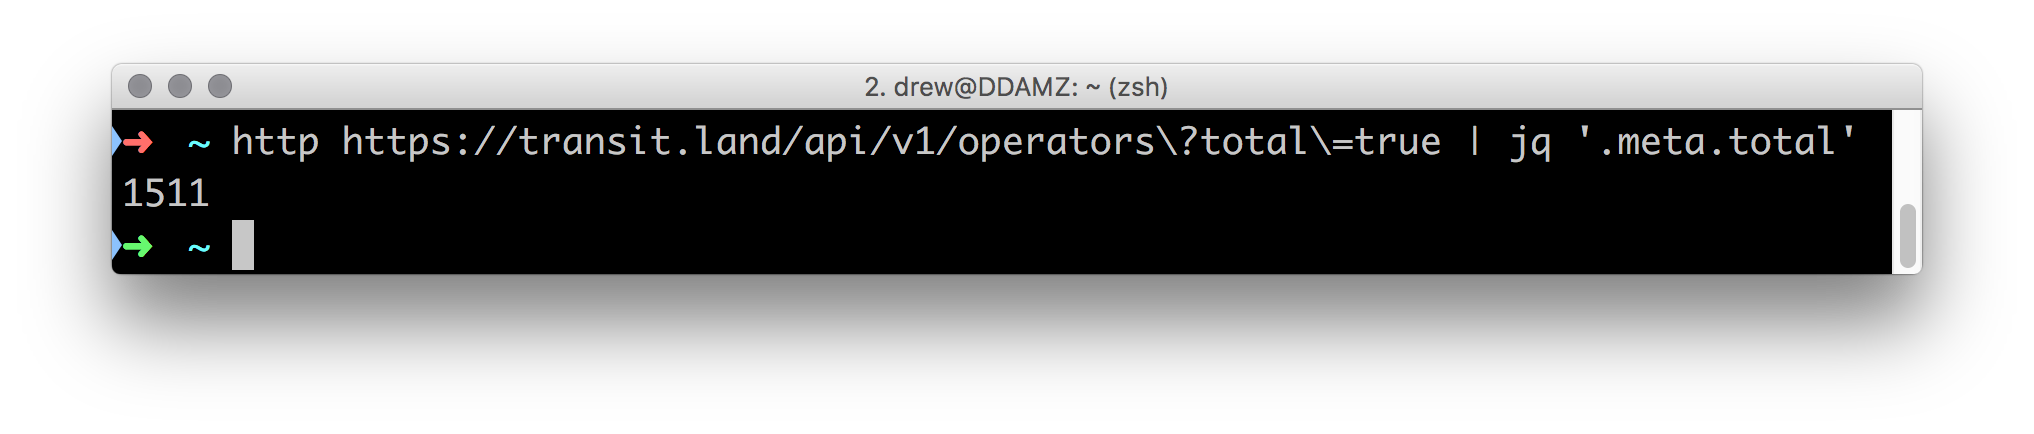
But if you’re impatient, don’t want to plot out a whole graph, and just want to know the current number of operators available in Transitland as it keeps on going up, here’s an easy way to get that from your terminal. Using the httpie and jq libraries:
And finally, as always, you can browse through all the operators in Transitland using the Transitland Feed Registry.
We’ve enjoyed this past year of working together on aggregating open transit data from around the world—and we look forward to continuing this impressive growth together!


