Welcome back! In last week’s post, One Minute Map, I walked you through how to get a simple map up on the web in just one minute using mapzen.js. This week, as promised, I’m here to show you how we can expand that simple map to display and style our own data. We’ll continue using mapzen.js for our basic map and will use a Tangram scene file to display our data on that map.
But why bother with a Tangram scene file? Isn’t mapzen.js (and tangram.js) just an extension of Leaflet? Can’t you just add a data overlay using Leaflet’s built-in methods?
You can! And it’s a completely acceptable way of adding data to a map. Here’s a quick demo to show you how this might work:
However…. notice how the polygons cover up the map labels? If you’ve made a web map in the past few years, you are probably familiar with this pattern. There are a lot of opinions out there about obscuring basemap labels, but let’s just say… it’s less than ideal.
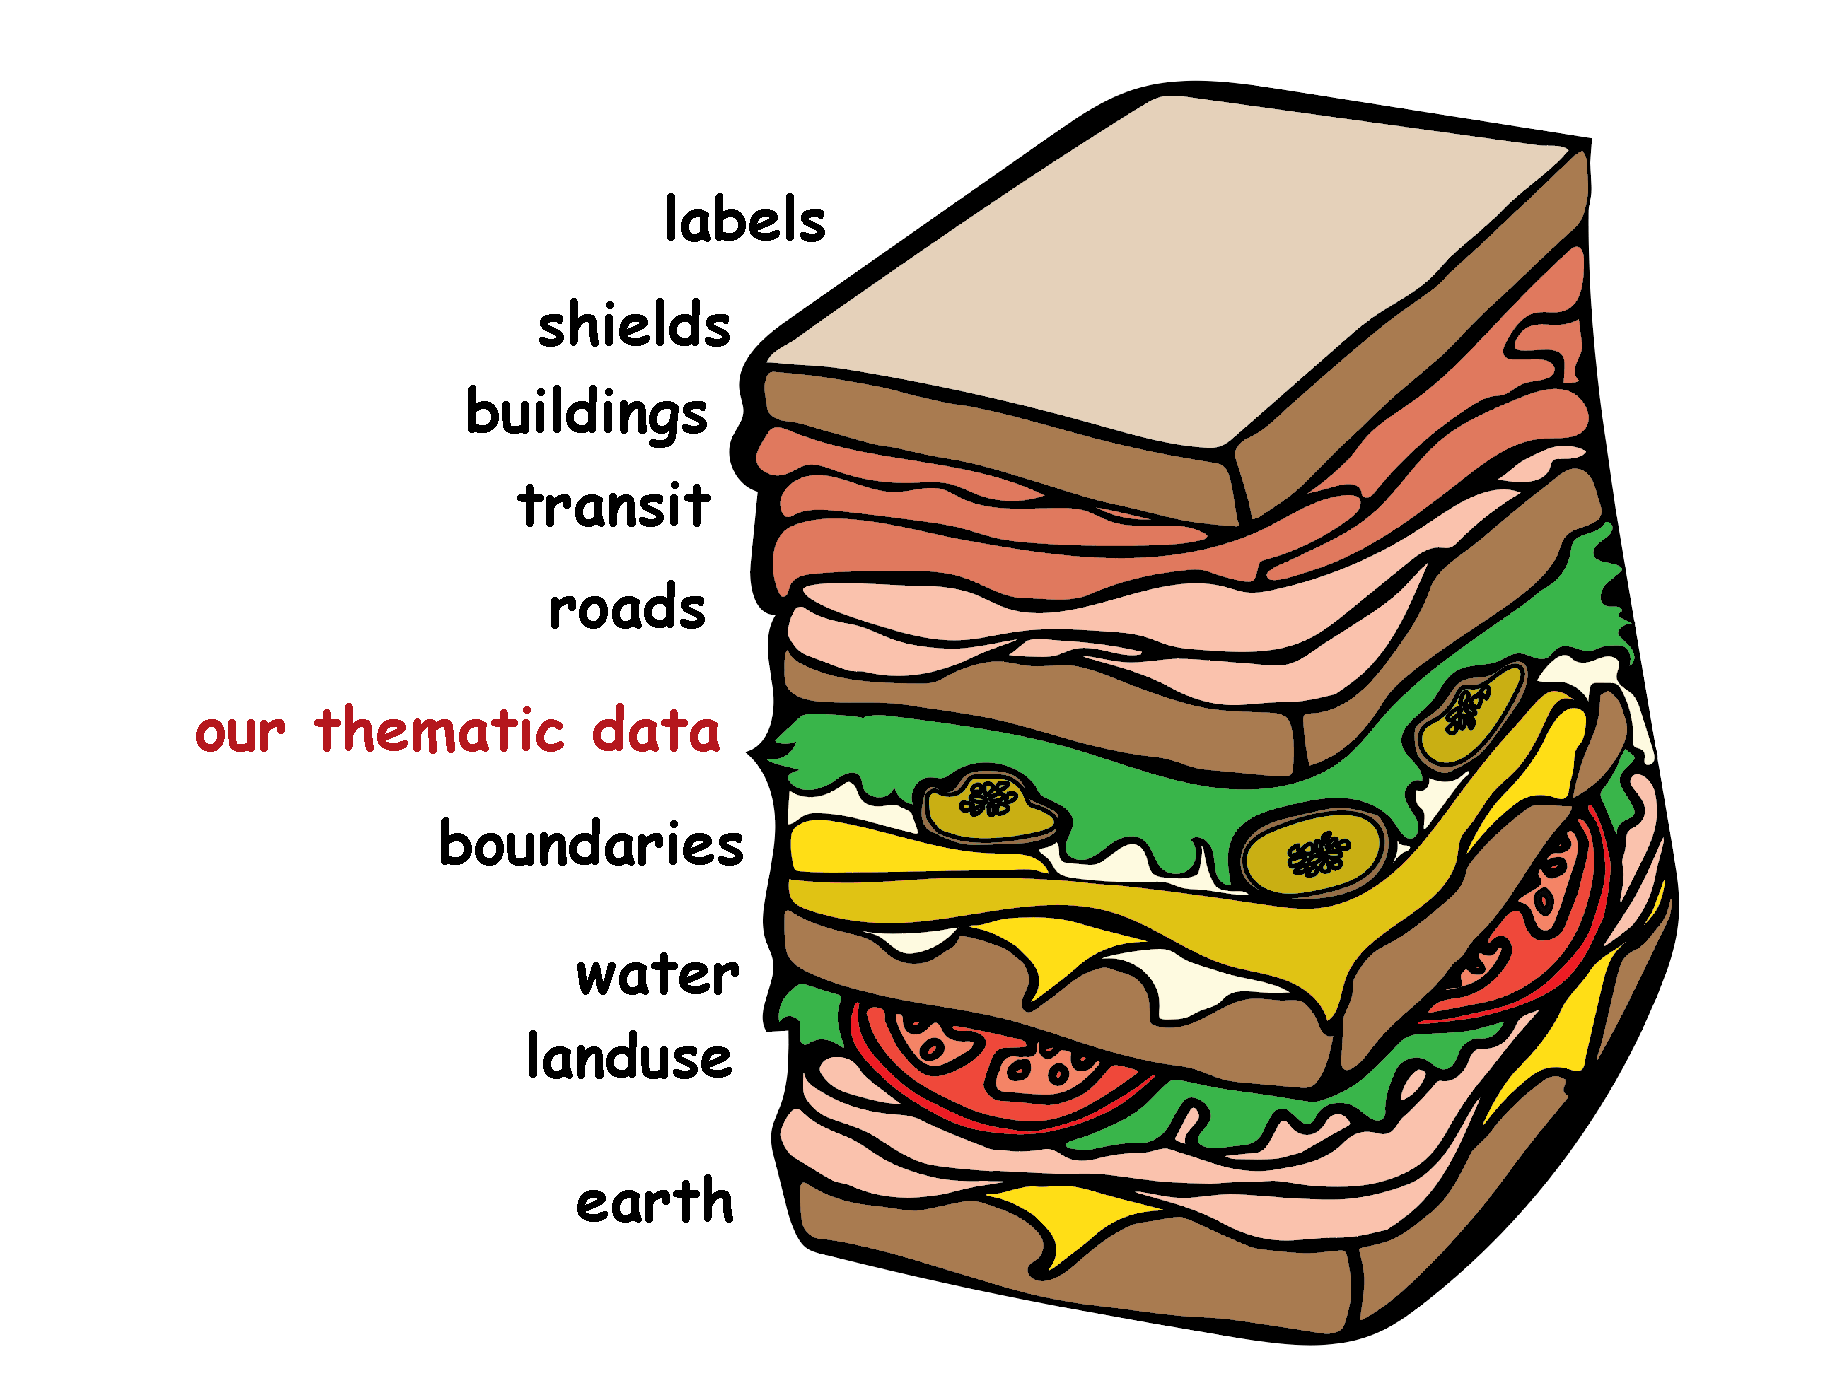
It’s not quite the map sandwich to which we aspire.
The classic map sandwich.
We can do better. In fact, let’s get started, and I’ll show you how to make your very own map sandwich.
Last week, we used a very (ahem) fancy https://gist.github.com to https://bl.ocks.org conversion to get our map on the web. It’s great for publishing a map very quickly, but not quite as great for making lots of little tweaks to our code as we test out new things.
If you’re ready to explore an alternative workflow, we’ve written some docs on setting up a bare bones development environment. This includes setting up a text editor and a few options for getting your map up on a web server. If you’re new to web development, I recommend you give it a read.
If you’d rather skip the text editor, go ahead and use the gist.github.com workflow from last week or check out blockbuilder.org, which automates the gist → bl.ocks workflow for you.
Thanks for the tip @ericsoco!
Thx for the One Minute Map, @mapzen! mapzen.com/blog/one-minut… FYI, you can make it a 5-second map with blockbuilder.org /cc @enjalot
— ericsoco (@ericsoco) October 26, 2016
OK, time to make a map…
We’ll start with a basic mapzen.js web map. Open up your text editor (or gist.github.com) and create a new file called index.html. Copy and paste in the following code block. It should look similar to what we used last week.
<!DOCTYPE html>
<html lang="en">
  <head>
    <title>San Juan Island</title>
    <meta charset="utf-8">
    <link rel="stylesheet" href="https://www.nextzen.org/js/nextzen.css">
    <script src="https://www.nextzen.org/js/nextzen.min.js"></script>
    <style>
      #map {
        height: 100%;
        width: 100%;
        position: absolute;
      }
    html,body{margin: 0; padding: 0}
  </style>
  </head>
  <body>
    <div id="map"></div>
    <script>
      // Mapzen API key (replace key with your own)
      // To generate your own key, go to https://mapzen.com/developers/
      L.Mapzen.apiKey = 'mapzen-JA21Wes';

      var san_juan_island = [48.5326, -123.0879];

      var map = L.Mapzen.map('map', {
        center: san_juan_island,
        zoom: 11,
        scene: L.Mapzen.BasemapStyles.Refill
      });

      // Move zoom control to the top right corner of the map
      map.zoomControl.setPosition('topright');

      // Mapzen Search box
      const geocoder = L.Mapzen.geocoder('mapzen-JA21Wes');
      geocoder.addTo(map);

    </script>
  </body>
</html>
UPDATE March 1, 2017: A Mapzen developer API key is now required for mapzen.js. We’ve updated the Make Your Own series to include a demo key. Generate your own free API key at https://mapzen.com/developers/.
Anatomy of a Scene File
Take a close look at the scene parameter:
scene: L.Mapzen.BasemapStyles.Refill
As I hinted last week, we can replace L.Mapzen.BasemapStyles.Refill with the path to our very own scene file. Go ahead and update that line to:
scene: 'scene.yaml'
Now let’s create that file. In the same directory as index.html, create a new file called scene.yaml. (If you’re working with a gist, be sure to add the scene.yaml file to the same gist using the “Add file” button at the bottom.) Copy and paste in the following code:
import: https://mapzen.com/carto/refill-style/6/refill-style.yaml

sources:
    _nps_boundary:
        type: GeoJSON
        url: https://gist.githubusercontent.com/rfriberg/684645c22f495b4a46f29fb312b6d268/raw/843ed38a3920ed199082636fe198ba995f5cfc04/san_juan_nhp.geojson

layers:
    _national_park:
        data: { source: _nps_boundary }
        draw:
            ...
So, what are we looking at here? There is a lot of information about scene files in Tangram’s documentation, so I won’t dive too deep here. But let me walk you through the basic anatomy of a scene file.
Our scene file has three top-level elements:
Import allows us to pull in other Tangram scene files.
Sources is a required element that we use to define our data sources.
Layers is another required element that divides our data into layers that can be styled.
Import
In this case, we use import to pull in the Mapzen Refill style. (The 6 in the url refers to the current Refill version number.) Any other data we add to this scene will be displayed in addition to this pre-defined scene file.
And that brings us to our data…
Sources
In honor of the 🎉 100th birthday of the National Park Service 🎉, I thought I would take a look at one of their smaller parks, San Juan National Historic Park, located on San Juan Island in Washington.
San Juan Island is best known for that time when the U.S. and Great Britain nearly went to war over the death of a pig.
For this exercise, we’ll be using National Park Service data, downloaded from Data.gov, which includes polygons for all of the national parks in the U.S. I went ahead and clipped just the San Juan NHP boundaries and added the data as GeoJSON to a github gist, so we can link to it directly in its raw format.
Layers
Once we have a data source defined, we can reference that source name when we define our layers. Here’s what a basic set of layers might look like:
layers:
  _layer_one:
    data: { source: _source_name }
    draw: ...
  _layer_two:
    data: { source: _source_name }
    draw: ...
Note: If you haven’t worked with Tangram’s YAML format before (or even if you have), the syntax can get a little confusing. To help differentiate between reserved keywords (like data and draw) and custom element names (like _layer_one), I’ll use an underscore before each custom name that is not reserved. No reserved words start with an underscore.
The draw element is where all of our styling magic happens, and we’ll focus on that in detail next time. For now, let’s set up a simple style for our national park polygons.
Styling our Data
In your scene file, add the following draw block:
        draw:
            polygons:
                color: '#BCE3B4'
                order: global.sdk_order_under_roads_0
Tangram’s YAML parser accepts color in a wide variety of formats, including hex, rgb, hsl, and named colors. We’ll get to that order parameter in just a minute.
While we’re here, let’s also add a border around our polygons by setting up a second draw style called lines:
            lines:
                width: 2px
                color: '#518946'
                order: global.sdk_order_under_roads_1
Reload your map and check it out.
If we zoom in…

What’s that you say? The labels are on top of your polygons?!
Why, you’ve made a map sandwich!
The Map Sandwich
Let’s take a look at this map alongside the Leaflet map I referenced above, so you can really see the difference:
GeoJSON as a classic data overlay
GeoJSON via a Tangram scene file
Pretty nice, right? Not only are labels placed on top, but we also display roads on top as well. This is especially important for providing location context to a map.
Setting up our own Tangram scene file, as we did here, gives us much more control over the placement of our layer. We can display our data in between the other layers, according to the order parameter that we set, and ensure that labels (and roads) remain on top.
In fact, we could add and reorder lots of layers and take our classic map sandwich into Dagwood territory:
A note about ordering
Tangram draws each layer according to the numeric order that is set by the scene file. Remember, we are importing an entire other scene file into our own, so layer ordering will depend on what is set in that scene file as well as in our own.
In this case, our imported Mapzen style is relying on a set of feature ordering rules specific to Mapzen vector tiles. With so many potential layers going into a complex basemap, you might see how ordering can get complicated… fast.
To make ordering within a large scene file (like one of Mapzen’s basemap styles) a little easier to swallow, our cartography team has developed a set of global ordering variables that we can use in our own scene file. This is where the global.sdk_order_under_roads_0 comes in. This variable (which happens to equate to 290 in this version of Refill) ensures our polygons are displayed under roads and labels (which have higher order values) and above pretty much everything else.
Let’s be honest here. Ordering layers on a map can be a tricky business. Creating global variables makes this easier, but we won’t stop there. We’re going to continue working to take some of that trickery out of working with complex scene files. Stay tuned for more updates. And as with all of our open source projects, discussion and contributions are welcome!
Next time, we’ll push our style a little further and look at how we can use JavaScript functions inside of our scene file to do complex filtering and styling. (Hello, choropleth maps…)
But before you go, let’s check out one more thing. I think you’ll like it.
Extra Credit
In your scene file, change your line width:
width: 2px
to:
width: [[8, 0.5px], [18, 5px]]
Here, we are changing the width of the line from a fixed pixel value to a dynamically changing value, using stops. In this example, the line width will be 0.5px at zoom 8 and below. As we zoom in, the value increases (by linear interpolation) until we hit the max. In our case, we’ll top out at 5px at zoom level 18.
By the way, this also works with width in meters, which is the default unit for width.
The full code for this exercise can be seen at https://bl.ocks.org/rfriberg/639dcdbe116d4bd1898ed29c754023c3.
As always, drop us a line if you have questions or want to show off something you’ve made with Mapzen. We love to hear from you!
Map sandwiches courtesy of Mapzen’s own @KatieKowalsky and @burritojustice.
Check out additional tutorials from the Make Your Own series:
