Since we launched our bike map in March, we’ve gotten lots of great feedback. Nearly a hundred of you took our survey, and we’ve been listening! Thank you! We’ve learned lots about biking experiences all over the world, how bike infrastructure varies from city to city, and the many ways people like to bike, along with the comfort levels of of what cyclists consider safe or unsafe.
Today we are releasing version 2 of the Walkabout bike map. This new iteration adjusts the color scheme, makes safer routes more prominent on the map, and combines bike route relations with bike infrastructure and street types. Happy Bike to Work Day and Month! 🚲
( This map is interactive! Open full screen ➹ )
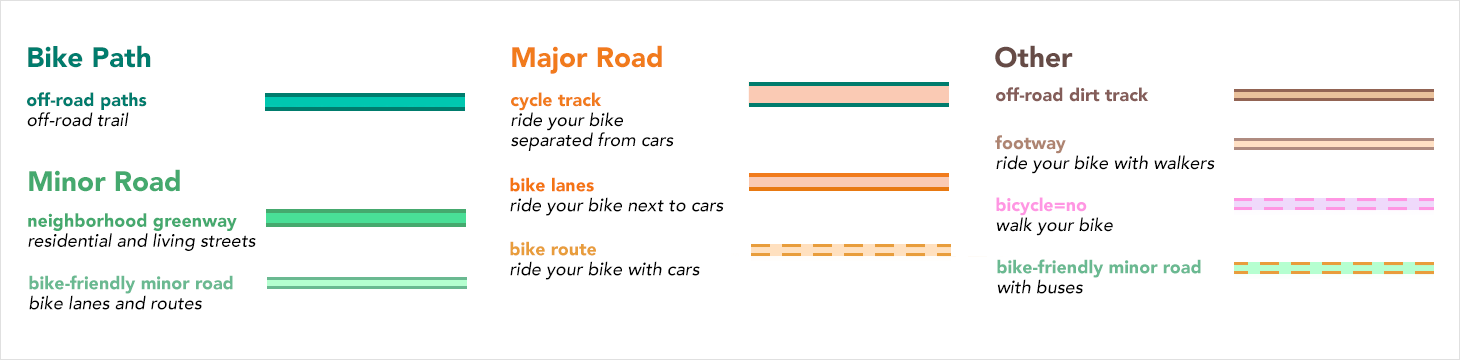
Legend: take two
No more blue! More green, plus dashed orange.
As usual, you can enable the bike overlay in just a few lines!
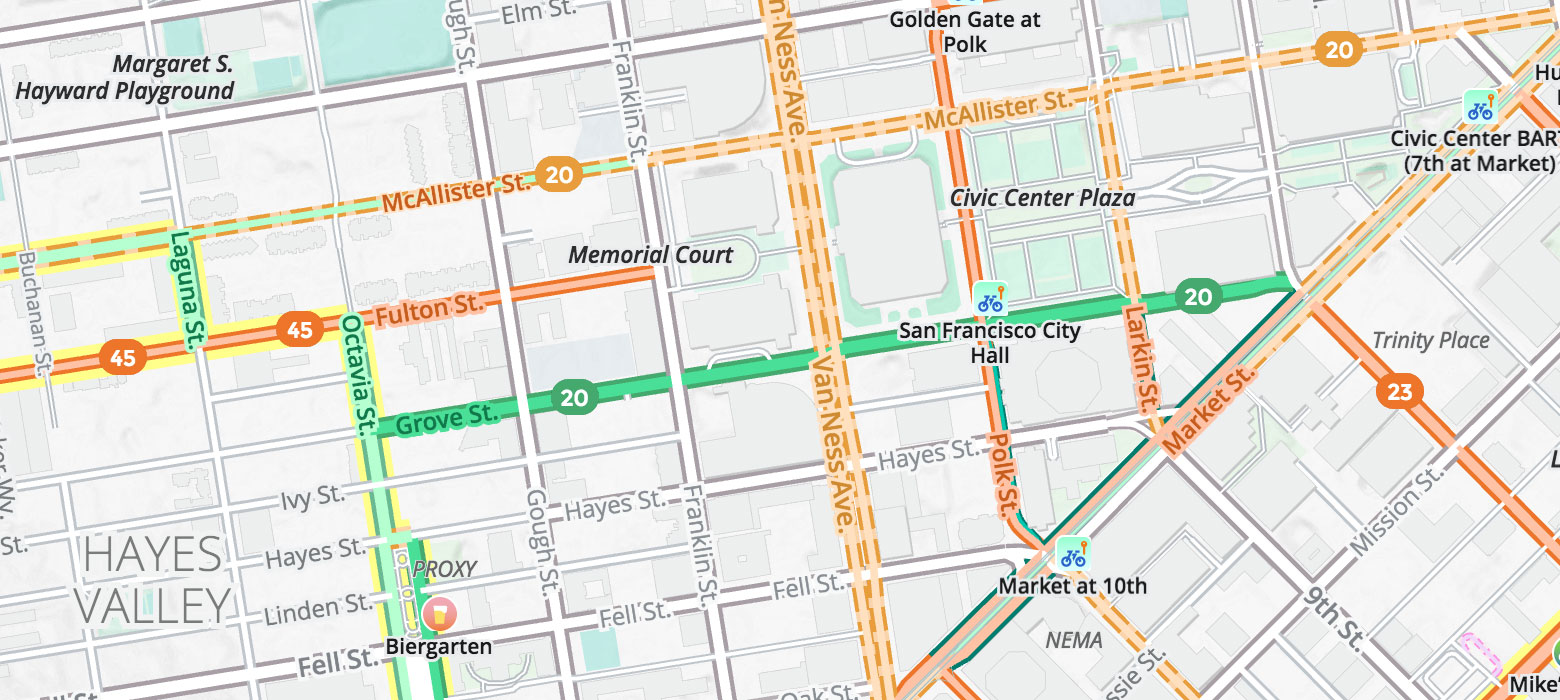
We know that people have different comfort levels and thresholds for safety when cycling. Some people want separated lanes (dark green), while others are OK riding alongside cars (orange lines), while yet others want to avoid buses (dashed orange edges and green fill).
Our goal is to give you enough information so you can make an informed decision on what’s safe for you, whether you’re biking near home or in places you might not be very familiar with.
In redesigning the bike map we kept our earlier questions in mind:
- What is the safest route?
- Do I have to ride with (lots of) cars (or buses)?
- Which side of the road should I ride on?
Take a look at the gallery, or jump below to learn how we took into account both road type, bicycle network, and bicycle infrastructure to emphasize safer routes on our updated bike map.
We’d love to hear your feedback in our poll!
Gallery
Thanks again to everyone who responded to our poll (which is still open!) Here are some previews for you.
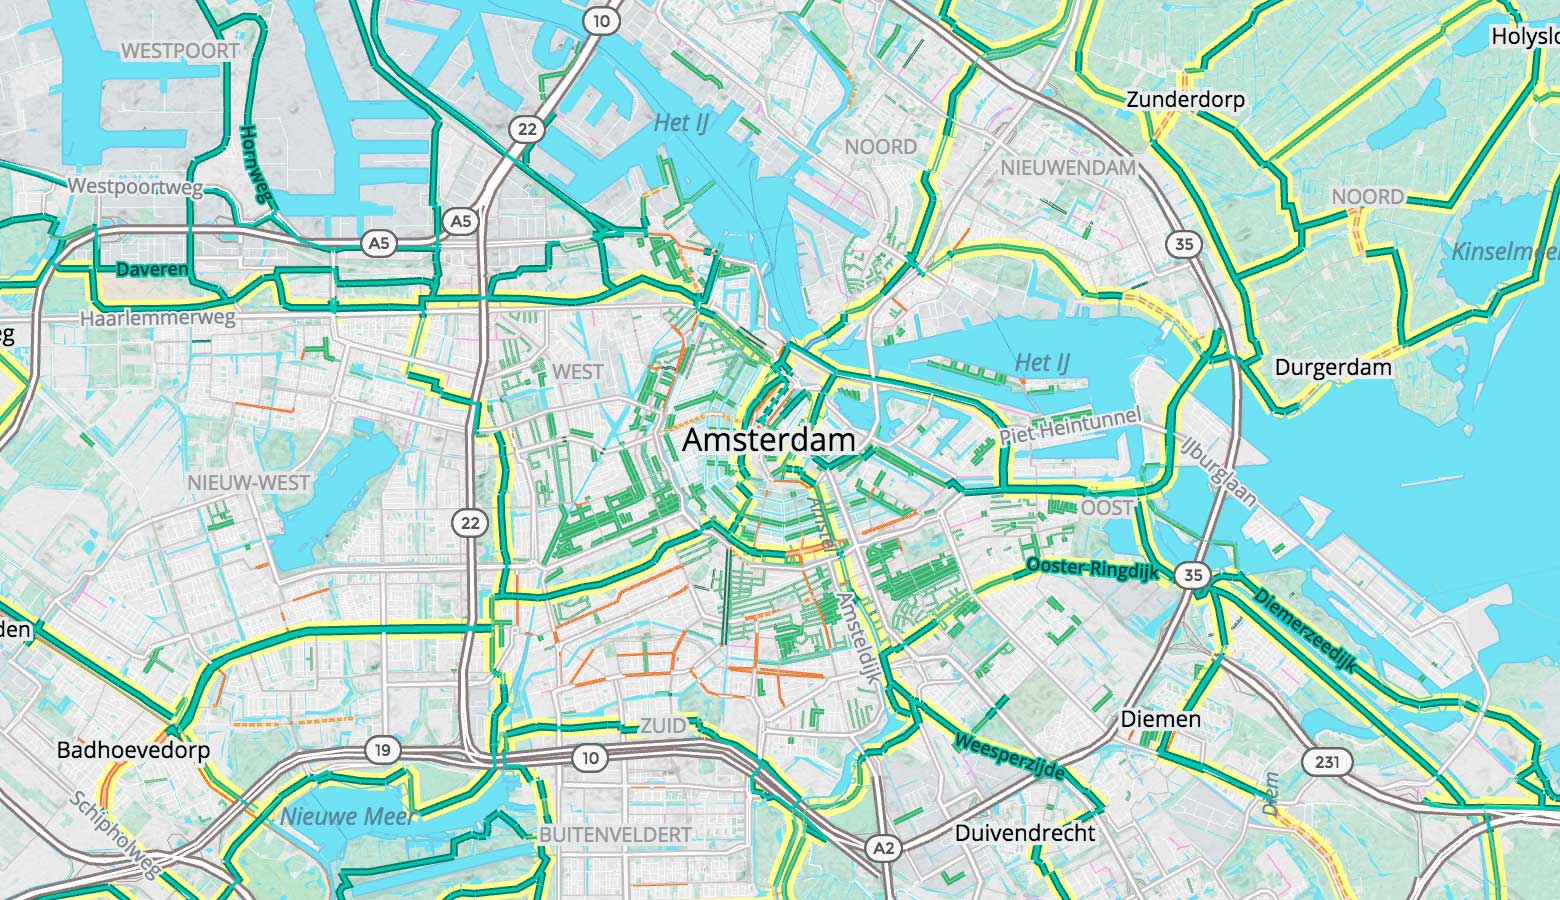
Amsterdam Zoom 12
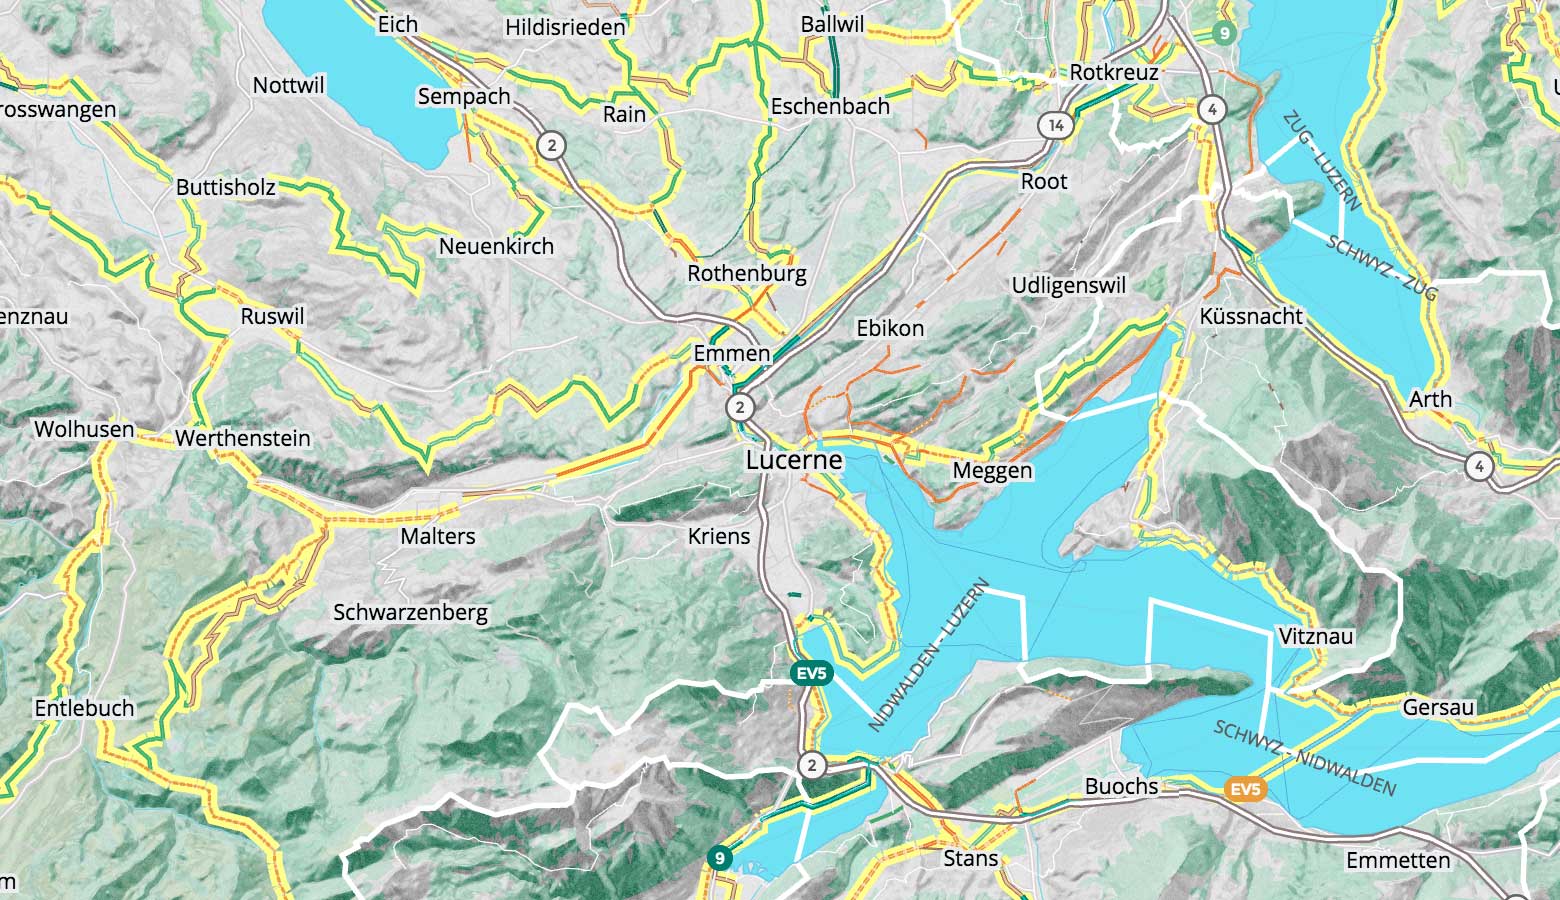
Lucerne Zoom 11
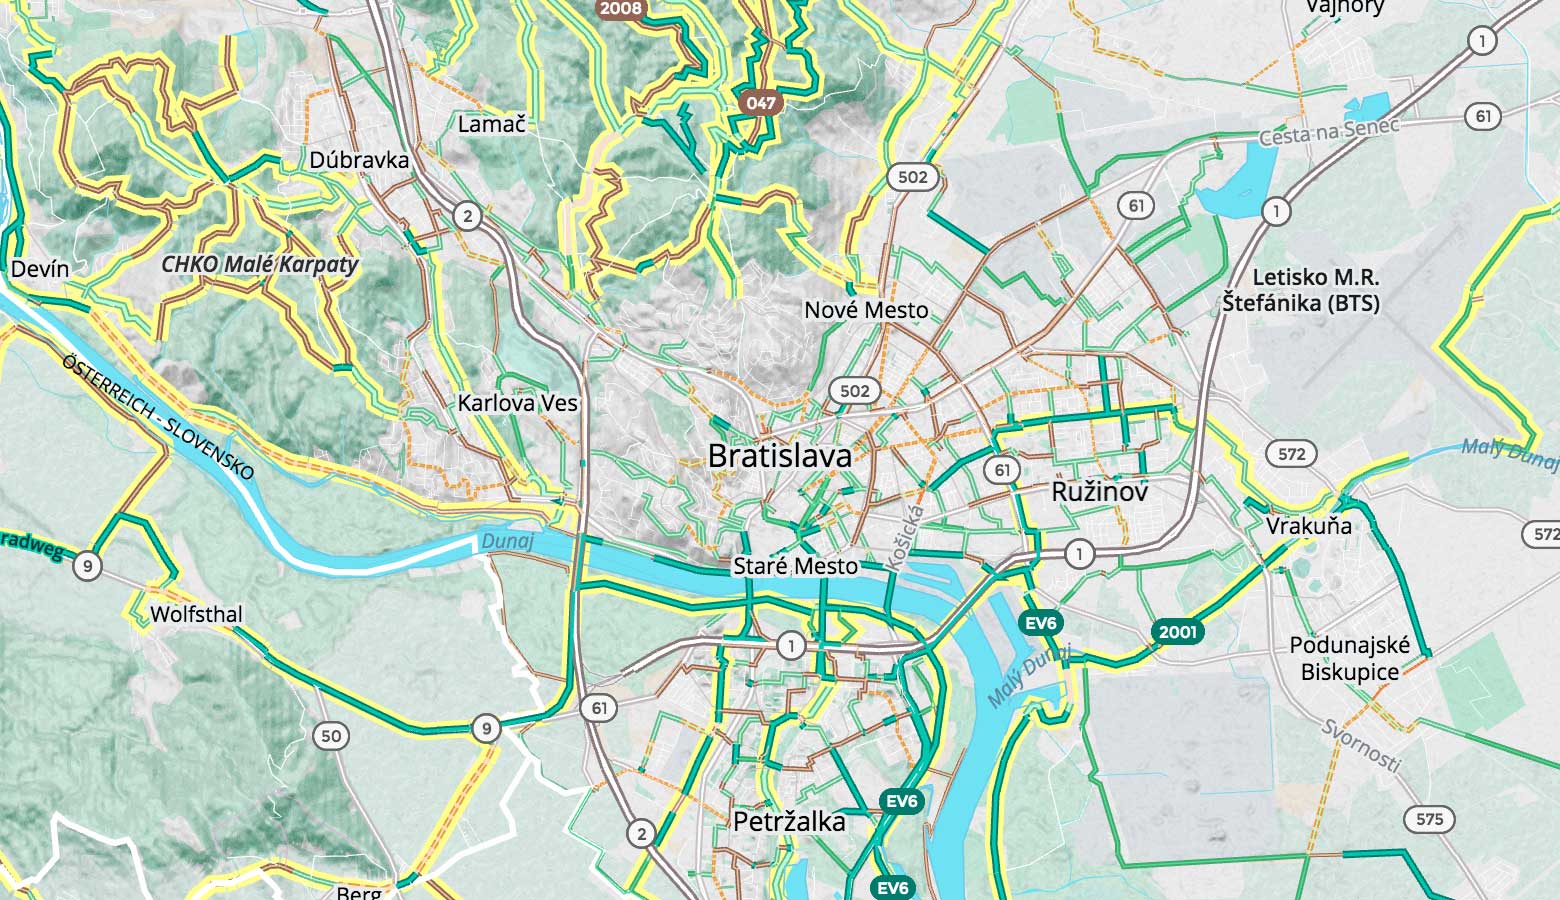
Bratislava Zoom 12
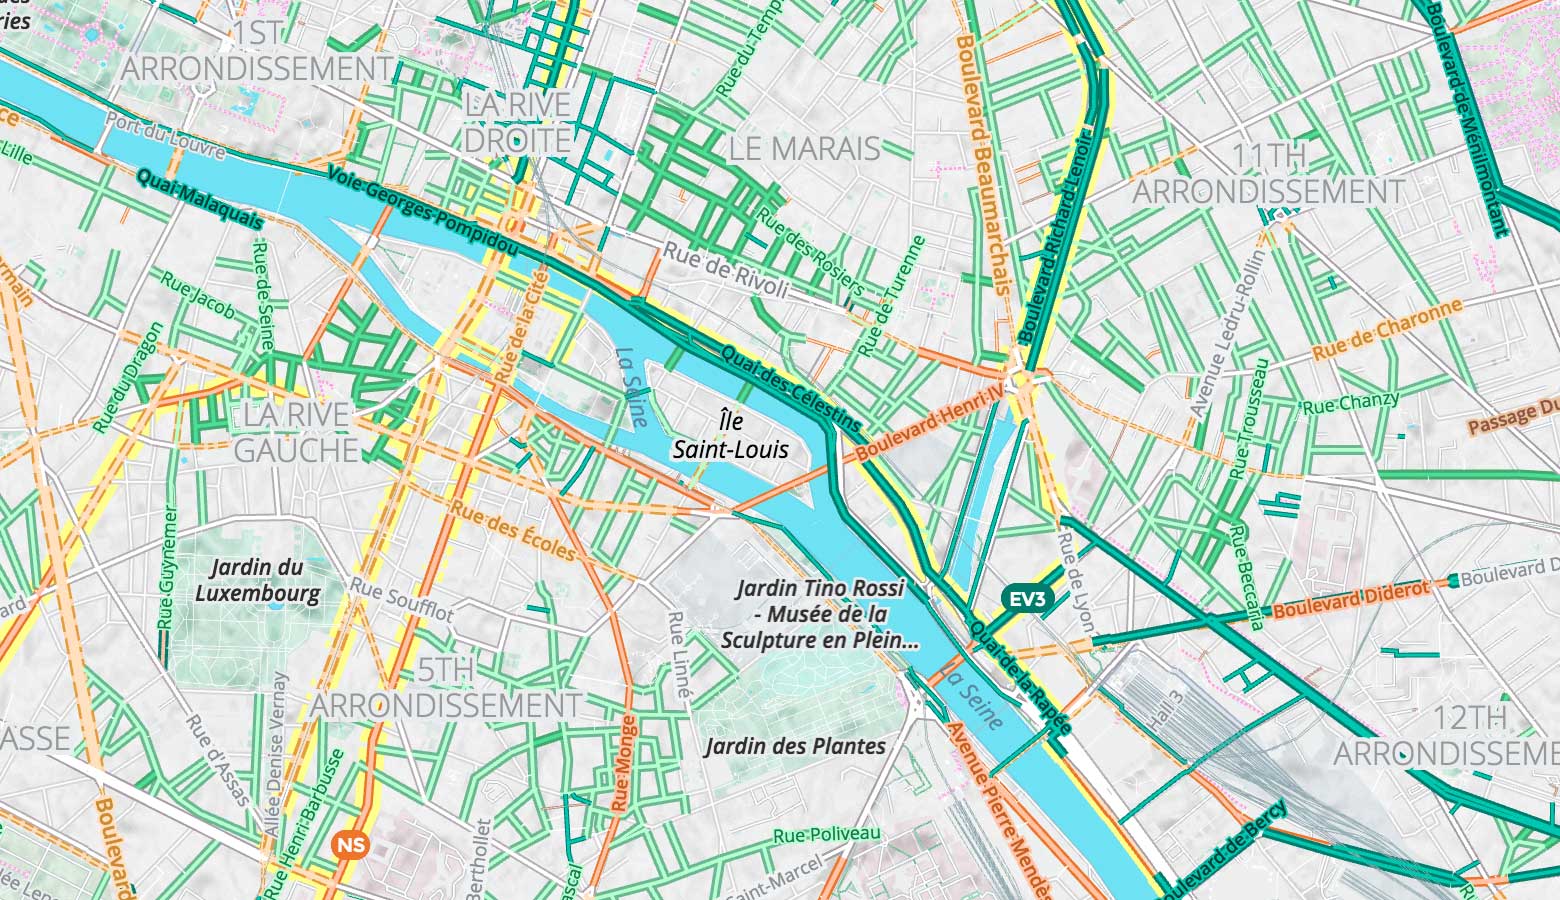
Paris Zoom 14
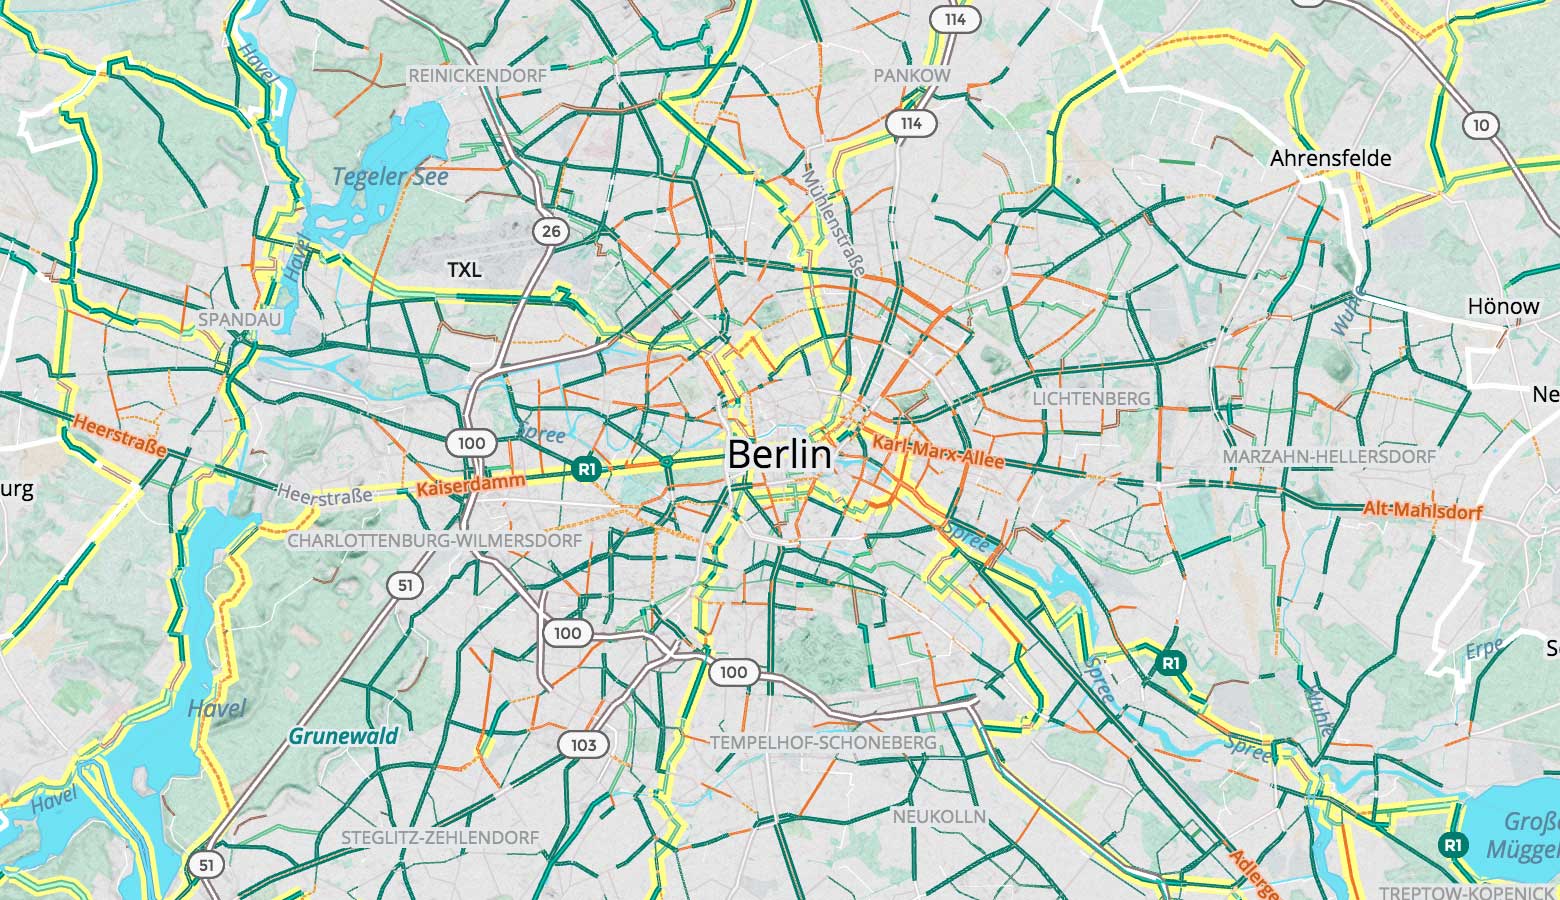
Berlin Zoom 11
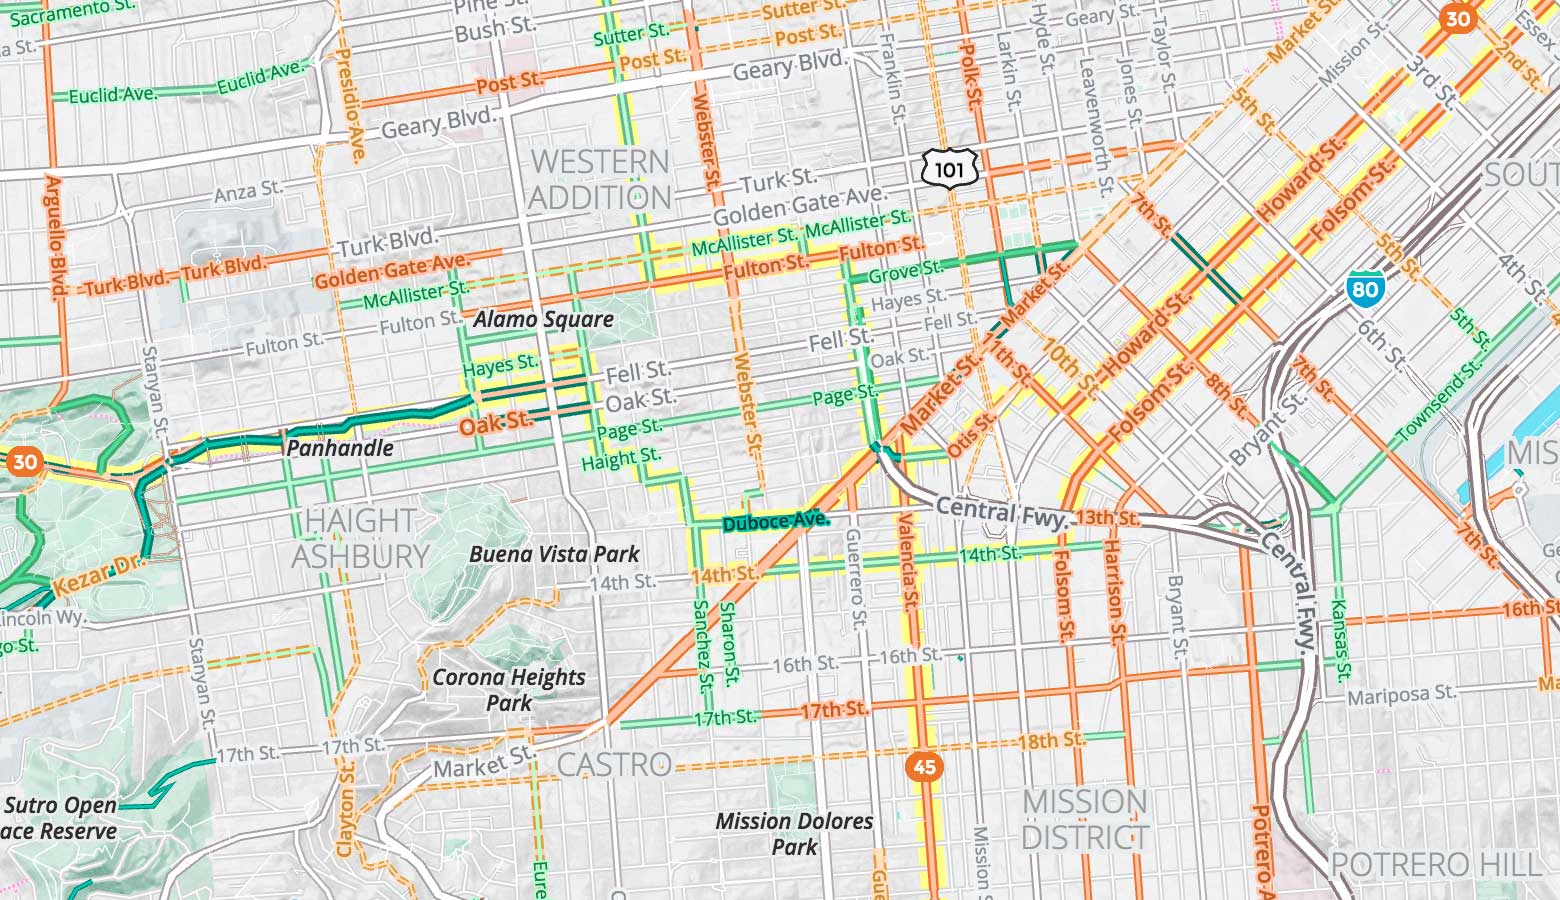
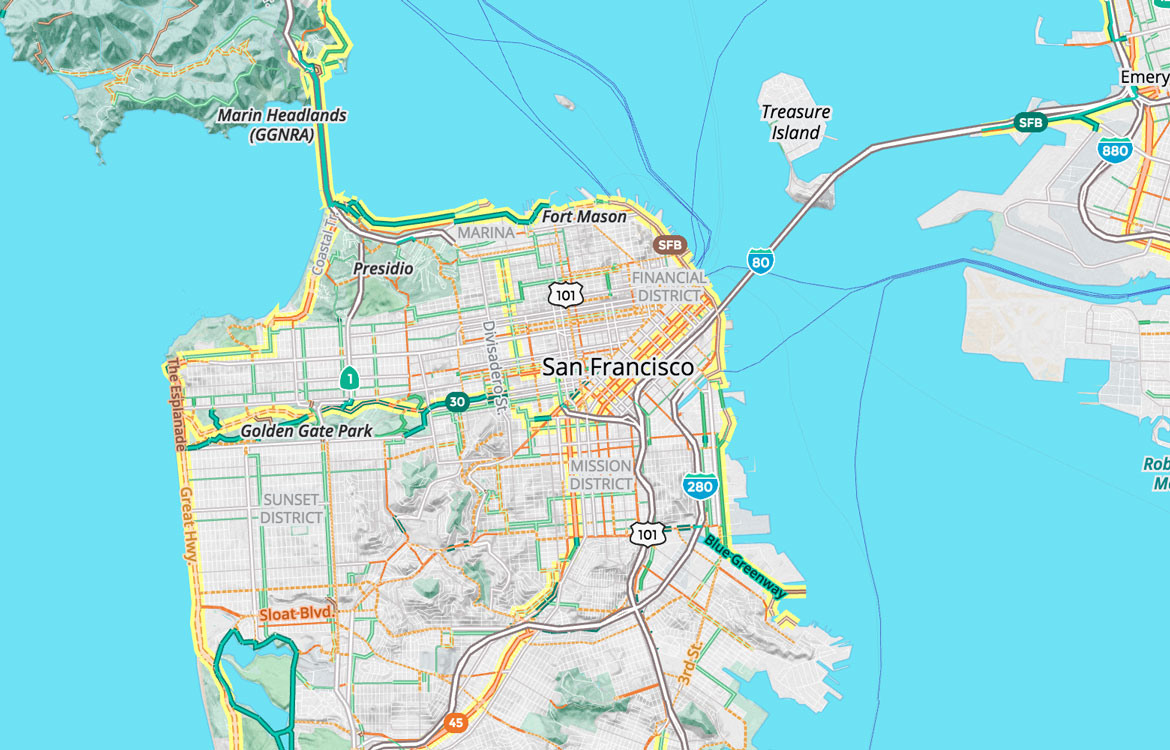
San Francisco Zoom 14
And links for everyone who sent in a response!
New Colors!
We got lots of feedback about color, and as a result we’ve simplified the scheme to orange and green. By breaking the two colors into various shades, darker to lighter, we are able to show even more details, with darker being “better” in the hierarchy of safety.
For example, see San Francisco below: dark green is used for cycleways (protected bike paths) in the Panhandle, while medium green shows “greenways” in Golden Gate Park (more on those in a minute), and light green indicates rides on lower-traffic minor roads.
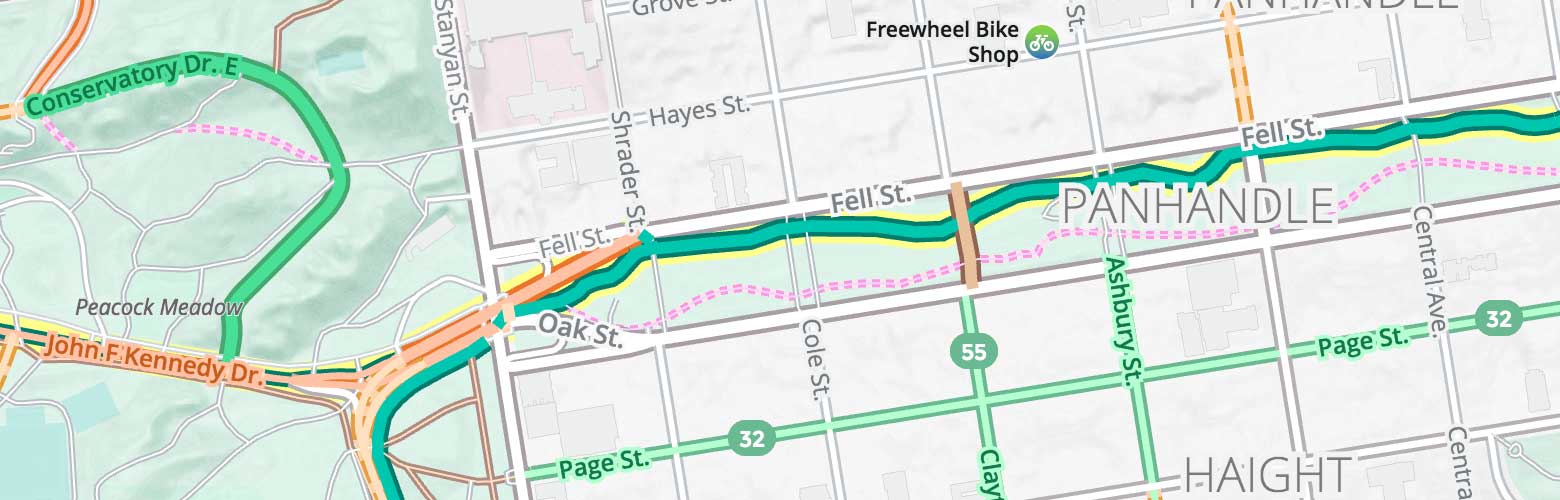
Three shades of green in the hierarchy: dark green cycleways in the Panhandle, medium green for the greenway on Conservatory Dr. in Golden Gate Park, and light green for Page St.
High Traffic Roads
The biggest change when considering colors on this new iteration of the map is the kind of road in addition to the bicycle data.
In the first version of the bike map, colors showed bike lanes and routes regardless of road type. But on this new version, we’ve addressed one major point of feedback, which is changing the way we emphasize high-traffic arterial roads versus more bike-friendly residential streets. Orange is now used for arterial roads, which generally have more car traffic. We’re also using the dashing element as a warning if there are no bike lanes on those high-traffic roads.
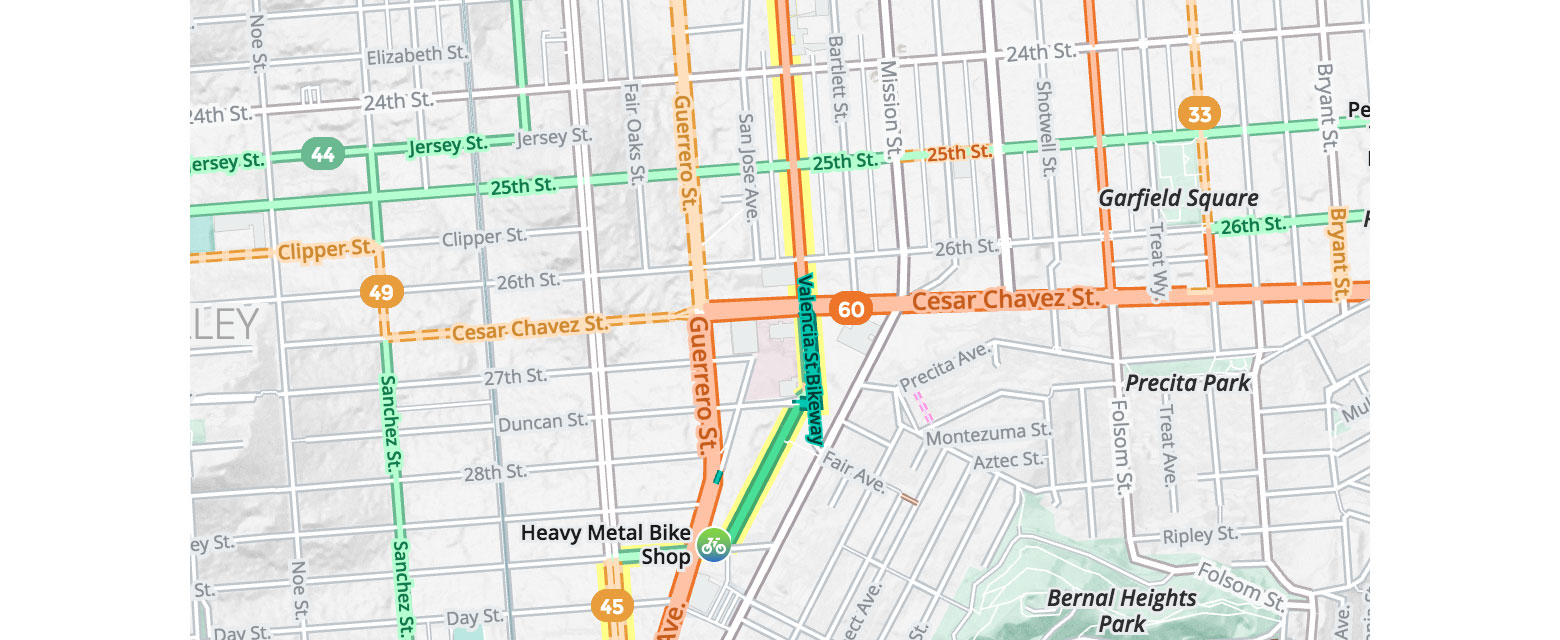
Cesar Chavez St. between Guerrero and Bryant is a major arterial with bike lanes shown in solid orange casing, but east of Guerrero bicyclists “share” the road with cars on a sign-only route shown with a lighter, dashed orange casing.
Brown remains the color used for tracks. Unpaved roads have now been added to this track category.
We’ve also removed the yellow highlight from local networks. Instead, we’ve emphasized the local network by adjusting line widths. This reduces the confusion of highlights and tier colors mixing visually. (Note we still highlight regional, national, and international networks.)
Greenway/Living Streets
After careful study and comparisons of the dozens of city bike maps you sent us, we’ve paid particular attention to “living street” and neighbourhood greenways, emphasizing their width and giving them the medium green shade, as well as revealing them at earlier zooms.
If a road is tagged as residential, unclassified or living street, as well as being part of a local cycle network, it will be shown in our new greenway category. Below is a more detailed definition of greenway or “bicycle boulevard” from the book Urban Bikeway Design Guide by the National Association of City Transportation Officials.
“Bicycle boulevards are streets with low motorized traffic volumes and speeds, designated and designed to give bicycle travel priority. Bicycle Boulevards use signs, pavement markings, and speed and volume management measures to discourage through trips by motorvehicles and create safe, convenient bicycle crossings of busy arterial streets.”
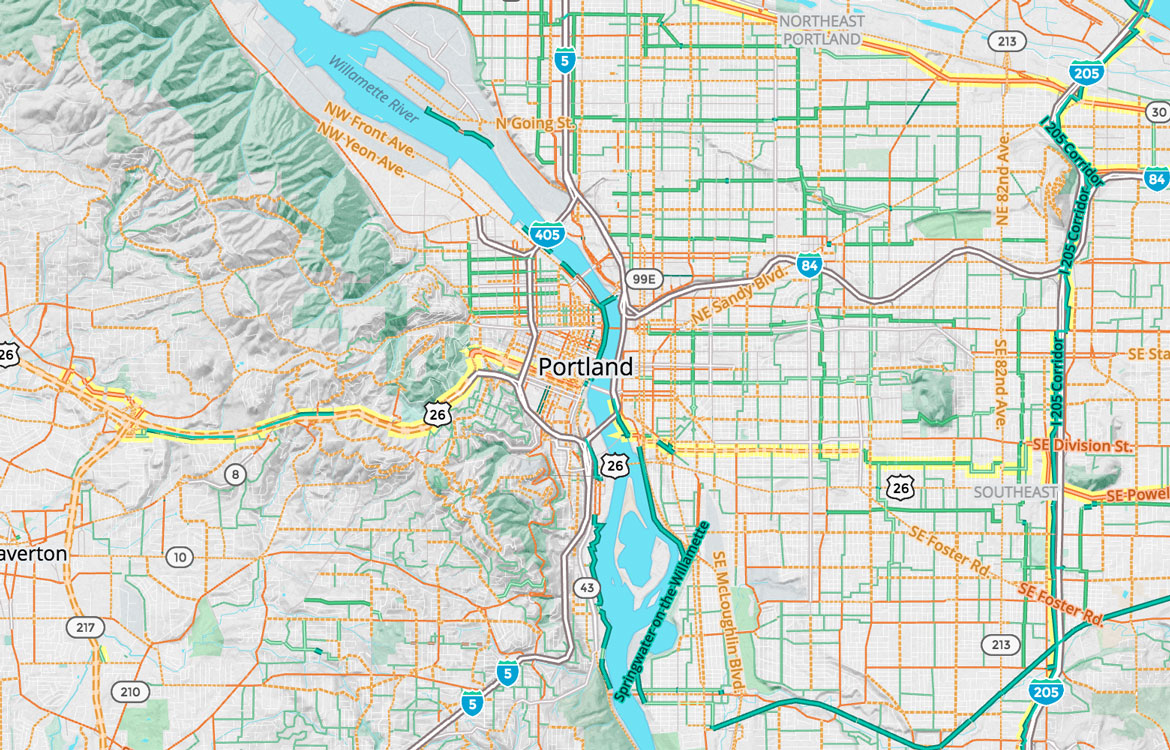
Zooming in on greenways in Portland: NE Tillamook Street, NE Morris Street, and NE Siskiyou Street
Learn more on how greenways are being used in Portland.
Other Road Color Changes
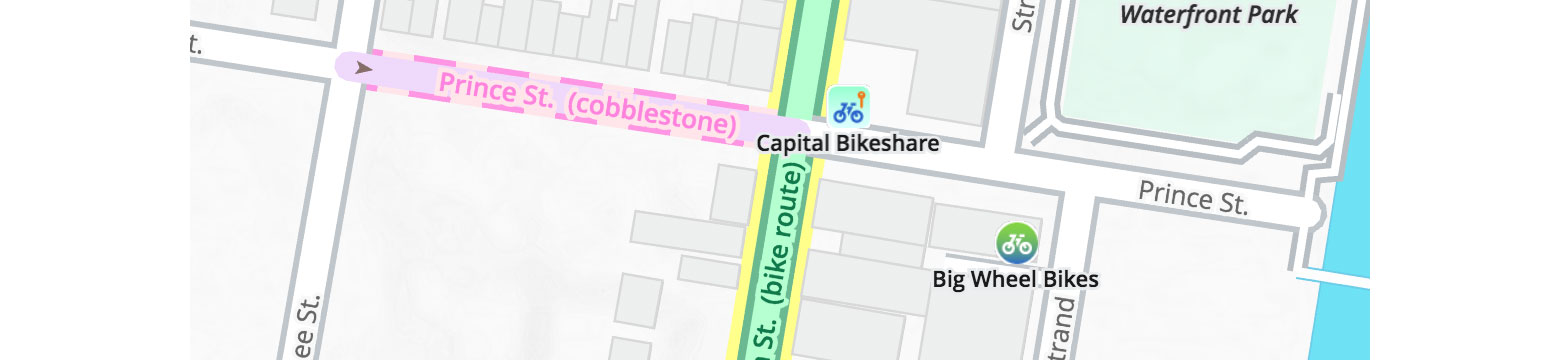
Cobblestone streets have been added to the bike map. (These are not fun.) See Prince Street in Alexandria below.
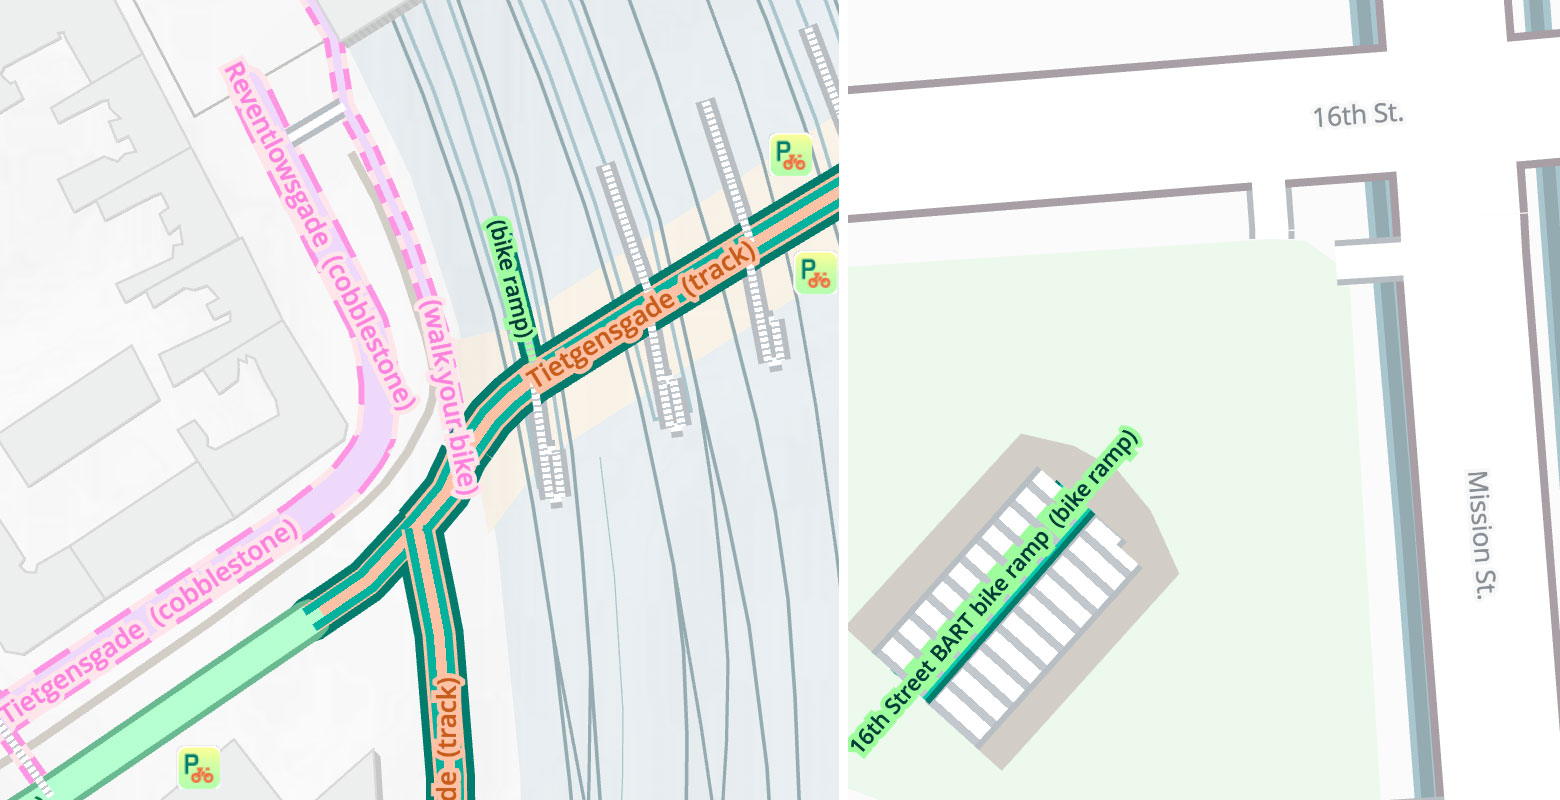
Bike Ramps have been added as well. (These are fun!) See Copenhagen below, along with San Francisco.
Bike Networks and Improved Coverage at Mid- to Low-Zooms
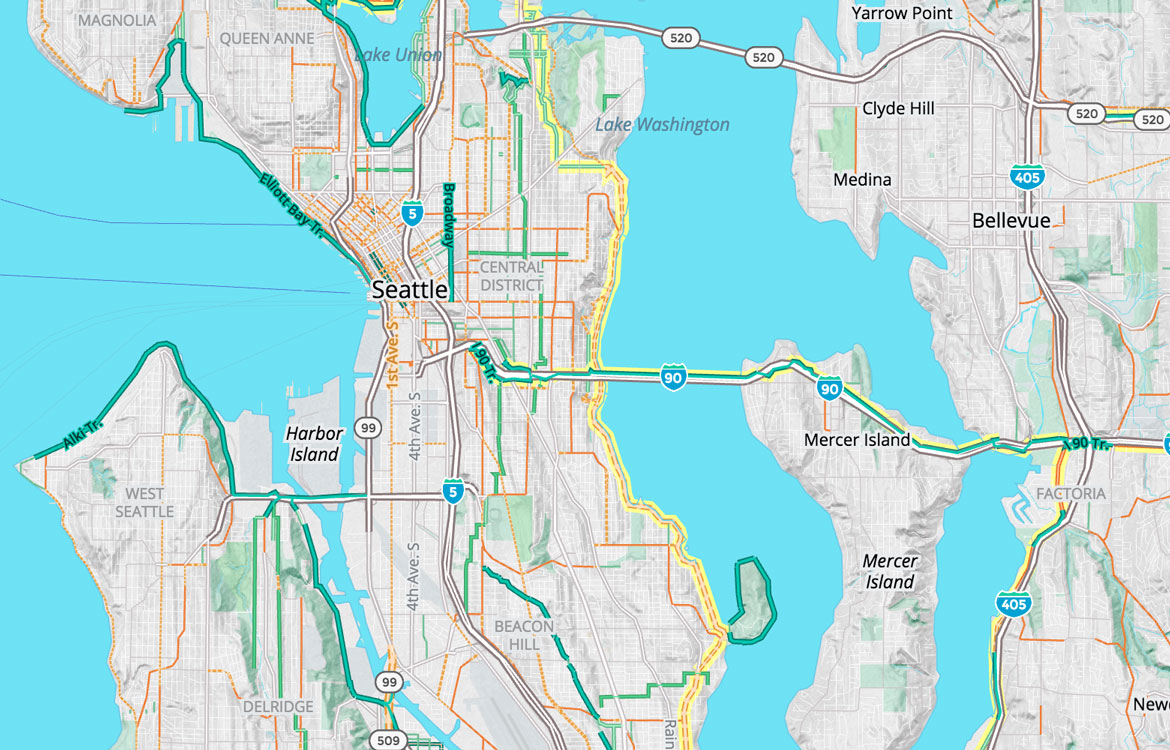
We found out from those who took the survey that almost everyone bikes in the city (97%). Half also bike outside the city, while 15% like to mountain bike, and 17% enjoy bike touring (through the country and along the coast). Given this feedback, we’ve focused a lot of our work on city overviews and made improvements connecting network views at the mid- to low-zooms. Seattle and Portland are good examples of how local networks and greenways are more readily visible.
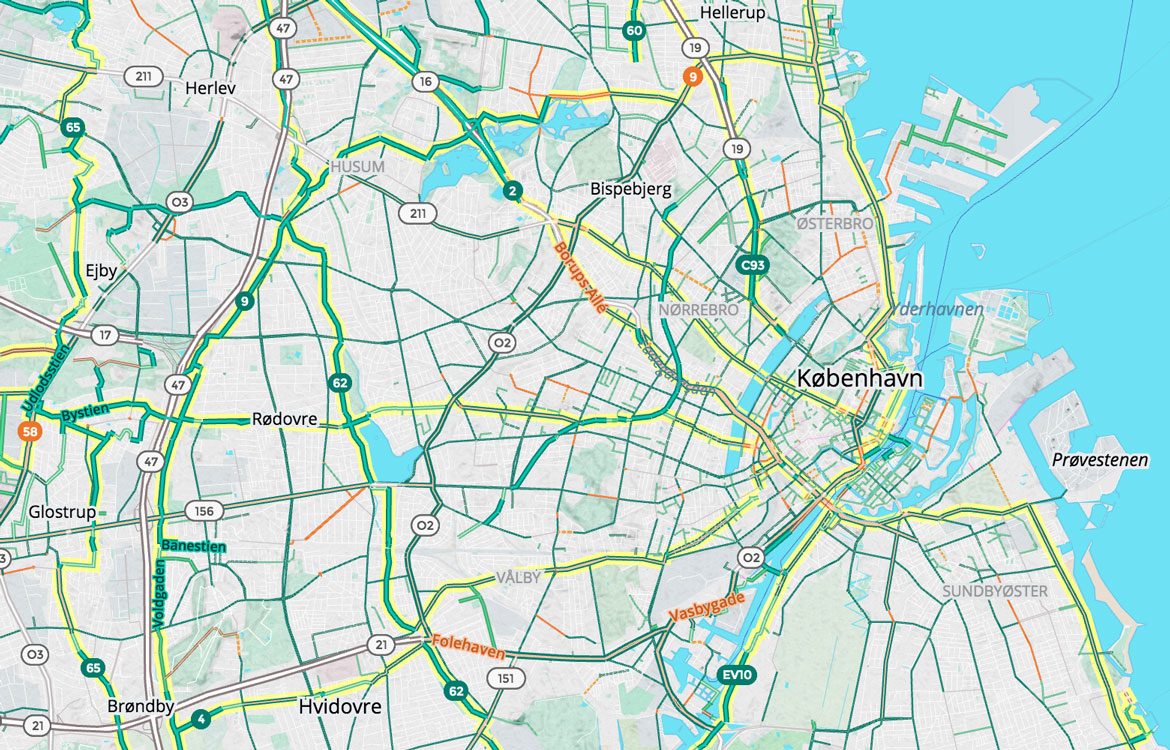
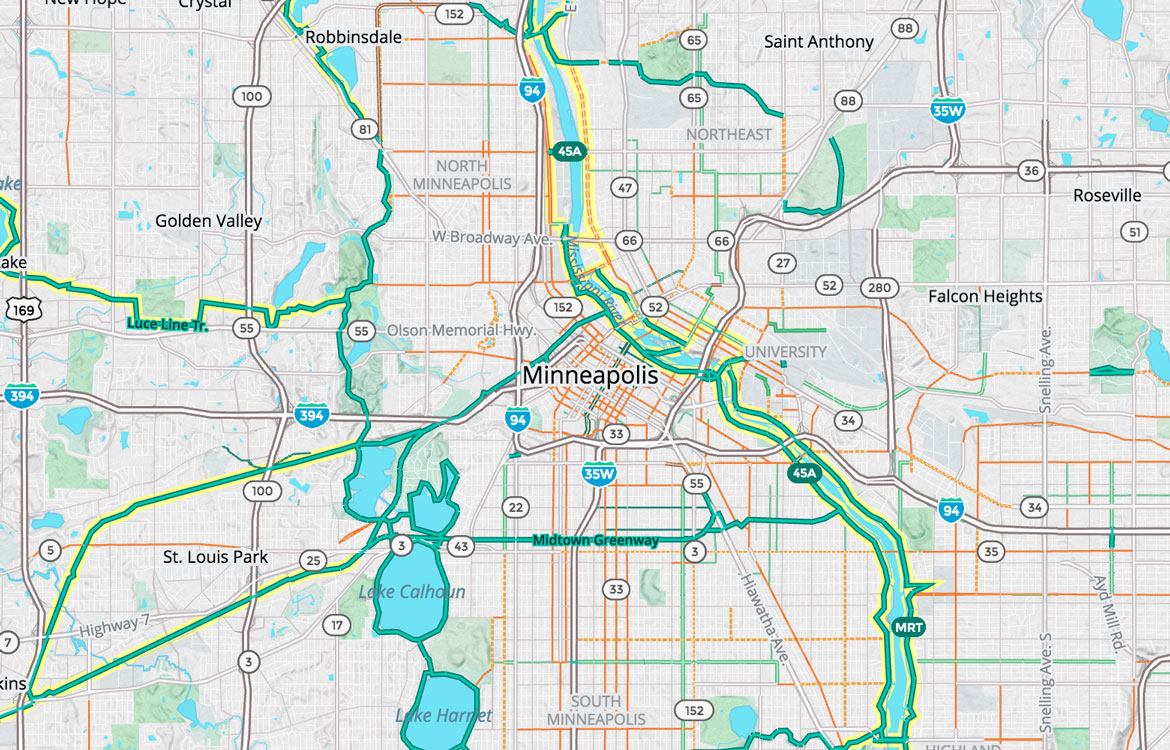
Below are more zoom 12 views of Copenhagen, Minneapolis, and San Francisco. Notice how bike infrastructure vary from city to city, from the overall green of Copenhagen’s numerous cycle tracks, to the green rings around Minneapolis and the Midtown Greenway cutting across the city, along with San Francisco’s primarily orange higher-traffic downtown area.
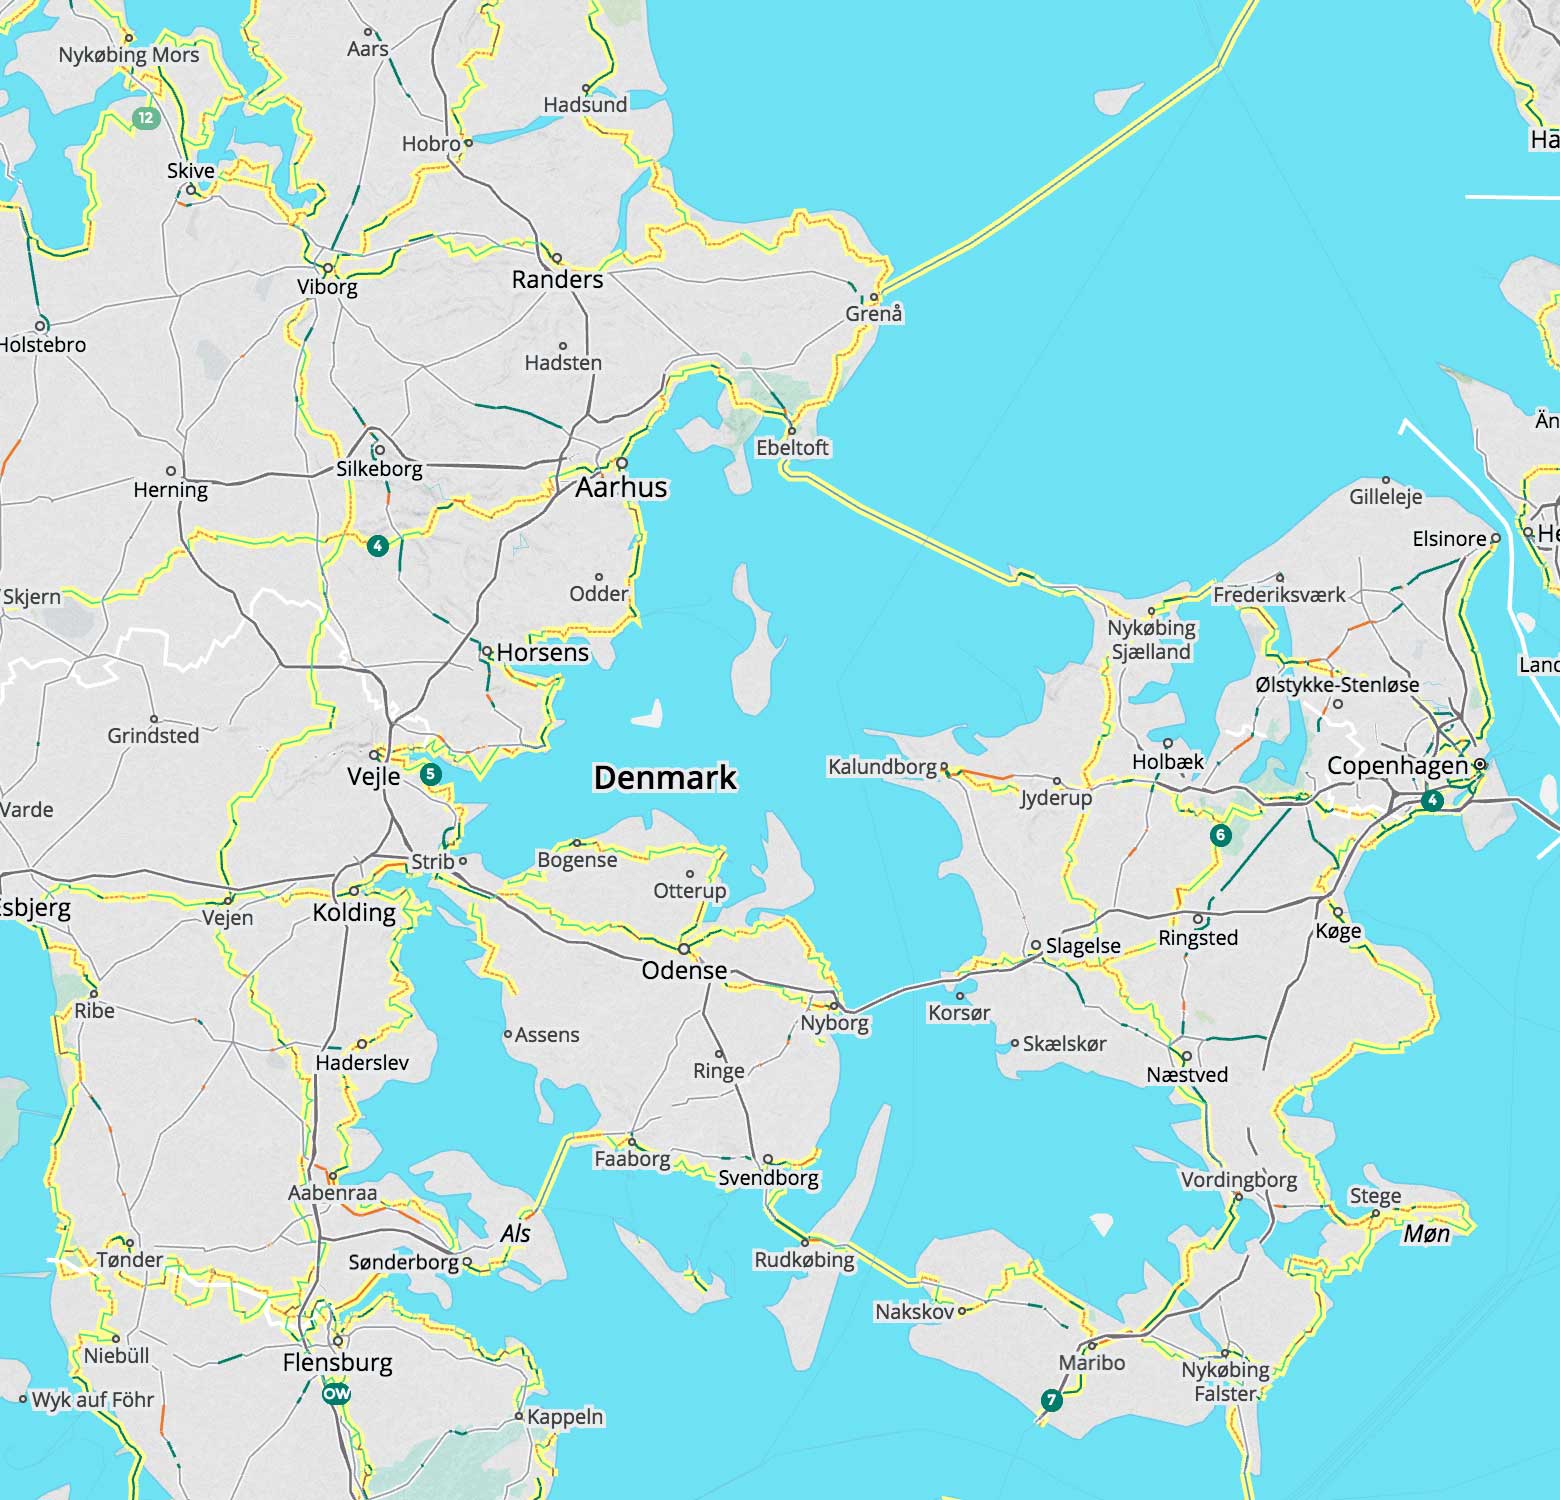
Zooming further out, you can see national and international networks thanks to significant enhancements in Mapzen’s vector tiles. And in Denmark we can see bike routes on ferries!
Bicycle Data From City to City
Regardless of the quality of the infrastructure, many cities are looking great (San Francisco; Portland; Washington, D.C.; Copenhagen). Some are a work in progress. Some are missing entirely, like Tokyo, but you can change that in OpenStreetMap! Check out our Targeted Editing post on cycleways to learn more, and get your bike network on the map.
Bike Shields
Some cities have numbered bike routes, so we’ve added bike shields using new data in Mapzen vector tiles!
Bike Icons
Bike icons have new colors and are now enclosed in attractive circular badges.

![]()
Bike icons in Copenhagen and New York
bicycle=designated
The future of bike tags is already here, it’s just not very evenly distributed in OpenStreetMap. We now show include bicycle=designated in our styling, which is commonly used in German cities, Portland, and many other places (especially for bike routes).
Get the Bike Overlay
Just like enabling languages, it’s very easy to turn on the bike overlay after importing the Walkabout basemap style in Tangram – just import the basemap and add a few lines! The Cartography docs include the following example and bonus map legend.
Set the required Mapzen API key to access vector and terrain tiles, disable the path overlay (which is on by default), and enable the optional bike overlay:
import: https://mapzen.com/carto/walkabout-style/5/walkabout-style.zip

global:
  sdk_mapzen_api_key: mapzen-xxxxxx          # your API key here
  sdk_path_overlay: false
  sdk_bike_overlay: true
If you’re using mapzen.js:
var map = L.Mapzen.map('map', {
  center: [40.8041, -124.1506],
  zoom: 15,
  maxZoom: 20,
  tangramOptions: {
    scene: {
      import: L.Mapzen.BasemapStyles.Walkabout,
      global: {
        sdk_mapzen_api_key: 'mapzen-xxxxxx',  // your API key here
        sdk_path_overlay: false,
        sdk_bike_overlay: true
      }
    }
  }
});
Work In Progress
We’re still working on these other suggestions we’ve received from you:
- Color blind mode
- Construction blockages
- Display steepness of grade
- Routing widget
The Future
We hope you like the color and styling improvements! We love getting your feedback. Let’s keep the conversation going as we continue to make improvements.
Let us know what you think. And our poll is still open!
Safe biking!

